
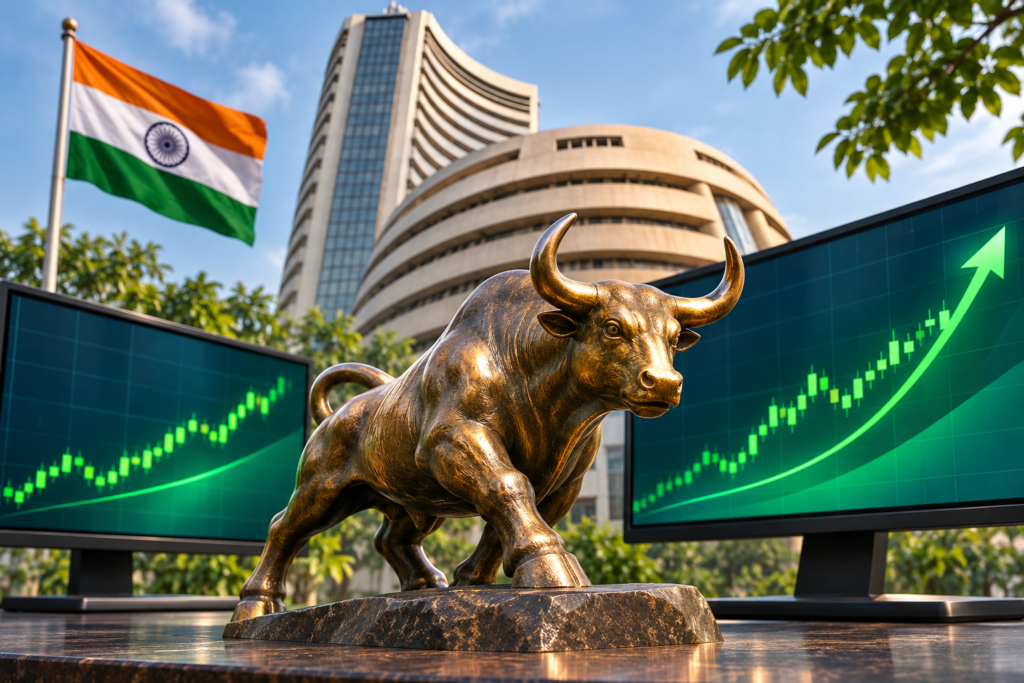
Indian equities rose for a fifth consecutive session on Wednesday, November 4, 2026. The Nifty 50 closed at 23,960.60, up 0.63%, while the S&P BSE Sensex finished at 77,301.40, up 383.55 points or 0.50%. Small-cap shares advanced more than the main benchmarks, and market reports highlighted real estate and defence shares. The session showed how a positive index close and strong participation can coexist with weaker results in individual industries. Upstox November 4 market wrap
November 4 closing levels and market breadth
The Nifty 50 ended 149.75 points above its previous close of 23,810.85, using the closing values to two decimals. Its percentage change is measured against that previous close. The Nifty Smallcap 100 rose 2.00%, outperforming the Nifty 50 by about 1.37 percentage points for the session. These index returns compare baskets of shares. Within each basket, companies can move in different directions and have different weights. November 4 market breadth and closing data
Market breadth asks how many stocks took part in the move. The same report, citing NSE end-of-day data, counted 2,177 advances and 539 declines among NSE-listed stocks in its tally. That is roughly four advances for each decline. The figures cover a broader universe than the 50 shares in the Nifty 50. A table that only counts benchmark constituents can therefore show a different ratio while accurately describing its own group.
What drove the Nifty and Sensex rally?
The session’s sector leadership provides evidence about where buying appeared. Upstox highlighted strength in realty and defence, while other areas did less to lift the market. It is useful to separate a strong sector return from a large contribution to the Nifty. A smaller sector can have the biggest percentage gain and still contribute fewer index points than a modest move in a group with a larger combined weight.
Reports also pointed to expectations about overseas investors and reaction to the US midterm election. Market commentary describes what traders may have been responding to at the time. Those explanations are easier to assess alongside currency moves, index futures, institutional activity and company news. A rally across small caps, for example, might tell you that demand went beyond a handful of the largest companies, while leaving open whether domestic buyers, overseas investors, or both supplied that demand. BuzzyBanana’s guide to Indian equities and the US midterms
How to interpret foreign and domestic fund flows
When checking a headline about foreign inflows, find the date and type of data used. Provisional cash-market figures show purchases and sales reported on the day. An estimate about future allocations describes what traders expect. A dataset that includes activity in other instruments answers a broader question. Comparing different datasets without their definitions can make a change look more dramatic than it is.
There is also a difference between a single session and a sequence. If overseas institutions are net buyers on one day, the size of that purchase matters relative to their recent activity and overall turnover. If foreign and domestic institutions trade in opposite directions, look at how the market performed across sectors as well as where the headline index finished. Those checks are more informative than treating an institution’s net buying figure as a stand-alone explanation. NSE institutional trading activity
What to compare in the next session
Begin with the previous close and keep a separate column for the opening level. A benchmark can open lower and still finish with a strong daily gain. Then compare the large-cap index with mid- and small-cap benchmarks and review the advance-decline figures for the same market universe. Finally, check whether the previous session’s leading sectors retained their gains or handed leadership to another group. This separates an enduring pattern from a move concentrated in one trading window.
For a comparison earlier in the week, use the same definitions when reading BuzzyBanana’s November 2 closing recap. In particular, distinguish the benchmark percentage move from a percentage change in a sector or an individual stock. November 2 Nifty and Sensex market recap
A useful daily record puts the data and interpretation in separate columns. Enter the benchmark close, breadth and sector returns first. Then record the explanations from contemporaneous coverage, with their timestamps. If an explanation relies on figures released later, mark it as a retrospective interpretation.
Frequently asked questions
What did the Sensex and Nifty close at on November 4?
The Sensex closed at 77,301.40, and the Nifty 50 closed at 23,960.60. Both gained from their previous session.
Did small caps outperform the Nifty 50?
Yes. The Nifty Smallcap 100 gained about 2%, compared with the Nifty 50’s 0.63%. That comparison uses closing returns for the two indices.
Can the closing figures show why the market rallied?
They establish the size and direction of the move. To evaluate possible drivers, examine sector leadership, market breadth, timestamped news and institutional trading data together.